As part of the secondment, an online visualization dashboard was developped. It could be tested on https://cloudloggers.site/map/.
Developped solution uses a custom API backend solution to dynamically get forestry data logger’s information and show it to users.
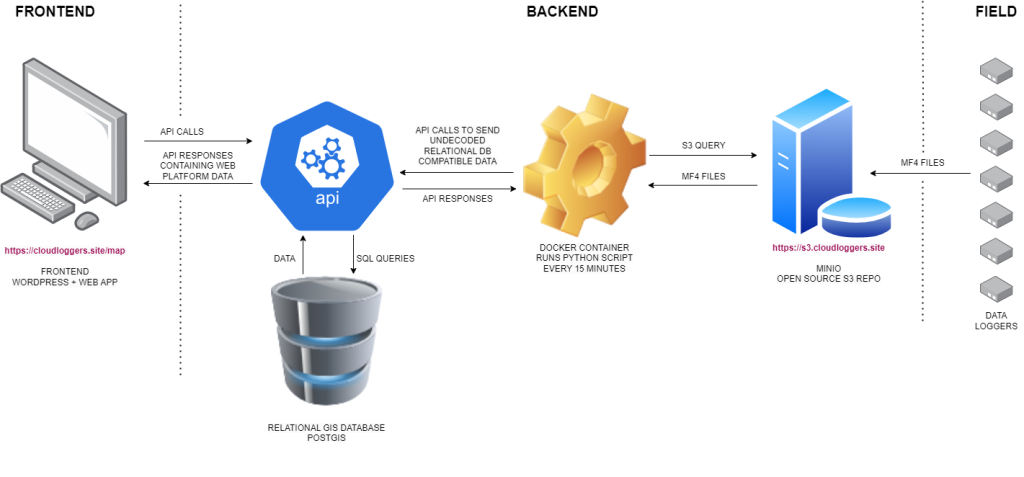
Following user flow diagram shows how the information from data loggers is stored into MinIO S3 server, how it is converted into relational database format and how it is shared through online visualization dashboard.
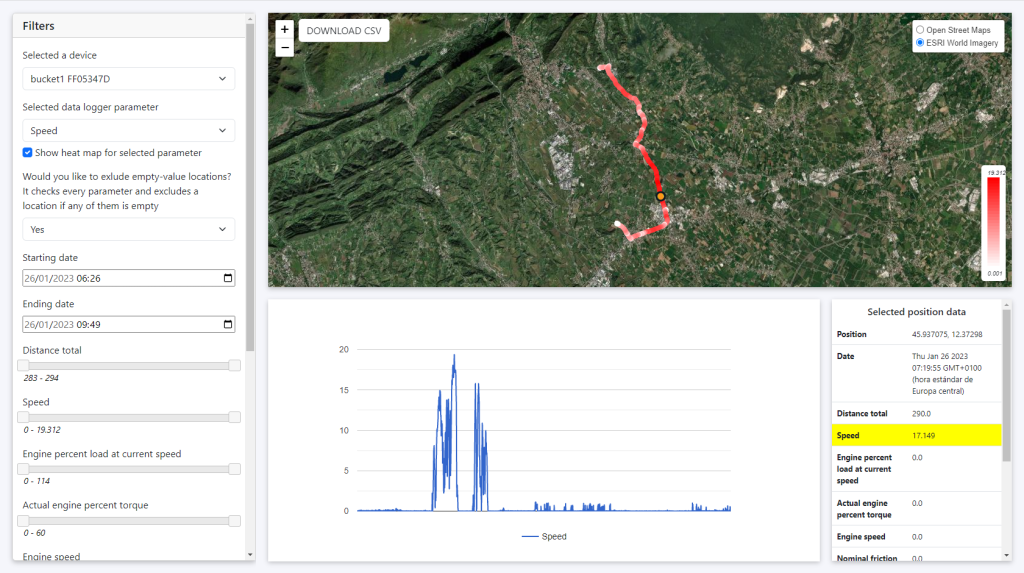
Provided solution allows users to filter data logger’s information, showing custo heat maps according t multiple data logger parameters, selecting between multiple data logger devices, downloading information etc.
More information: https://cloudloggers.site/map/